
1. Market Structure
The pair has shifted into a bearish phase on the daily timeframe. After failing to make a new high in April, the price formed a lower high and has been aggressively pushing downward.
2. Support Breakout
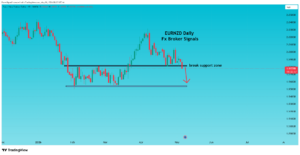
As you correctly noted with the “break support zone” label:
-
The Level: Price has successfully broken below the major horizontal support around the 1.98000 psychological level.
-
Confirmation: The daily candle closed decisively below this zone, signaling that sellers are in full control and the previous buyers’ area has failed.
3. Next Target Zone
Following your red arrow, the price is likely heading toward the next significant liquidity pool:
-
Target: The lower support zone sits between 1.95300 and 1.95800. This area acted as a strong floor back in February and March 2026, so it is the most logical place for the price to seek support again.
4. Trade Execution Idea
-
Retest Play: Often, after such a clear break, the price may pull back slightly to “retest” the broken support (which now acts as new resistance). If you see a bearish rejection candle (like a shooting star or engulfing) at 1.98000, it would confirm a high-probability sell entry.
-
Continuation: If the bearish momentum remains extreme, it may hit the 1.95500 target without a deep pullback.
